
Debugging modern Office Add-ins with current tooling can be quite challenging. Although the technology of the add-ins you write is consistent and conforms to web standards (HTML, JavaScript, CSS), the way the add-in is hosted in the different Office clients makes it challenging to use debugging tools (as the add-in isn’t simply running in a web browser).
Debugging in Office Online (web browser versions of the Office products) is probably the simplest to use existing debug tools, and simply using F12 debug tools in IE, Edge, Chrome will give you access to the Console, DOM and inspection of HTML and CSS.
Desktop Office clients make it a bit harder since you can’t just start the F12 debugger tools because you are not in a full browser (like Edge or Chrome). Luckily Microsoft have provided a standalone version of the F12 tools (F12Chooser.exe) that you can use to attach to the running instance of the Desktop Office client.
https://dev.office.com/docs/add-ins/testing/debug-add-ins-using-f12-developer-tools-on-windows-10
Once you start talking about devices such as iPhones and iPads it begins to get even more difficult. Most documentation points you in the direction of Vorlon.JS which provides a good remote debugging experience, but involves a fair bit of setup, configuration and embedded scripts in your addin as well.
https://dev.office.com/docs/add-ins/testing/debug-office-add-ins-on-ipad-and-mac
Rather than go down the Vorlon.JS route, I’ve come up with the a technique which is more lightweight than the Vorlon.JS approach and instead uses Firebug Lite. Firebug Lite is an in-page debugging tool that can be added to a webpage by embedded JavaScript into your add-in. The example below adds a hyperlink to the page that will launch the Firebug debugger when clicked.
<a href="javascript:(function(F,i,r,e,b,u,g,L,I,T,E){if(F.getElementById(b))return;E=F[i+'NS']&&F.documentElement.namespaceURI;E=E?F[i+'NS'](E,'script'):F[i]('script');E[r]('id',b);E[r]('src',I+g+T);E[r](b,u);(F[e]('head')[0]||F[e]('body')[0]).appendChild(E);E=new%20Image;E[r]('src',I+L);})(document,'createElement','setAttribute','getElementsByTagName','FirebugLite','4','firebug-lite.js','releases/lite/latest/skin/xp/sprite.png','https://cdnjs.cloudflare.com/ajax/libs/firebug-lite/1.4.0/','#startOpened');">Firebug Lite</a>

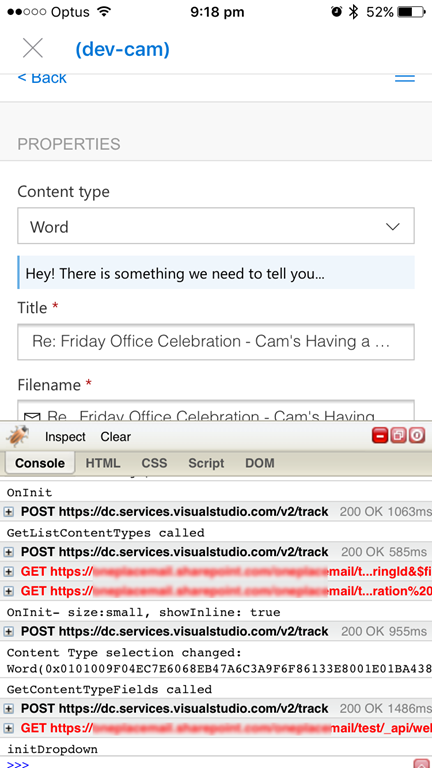
This link now appears in the add-in and clicking on it starts the Firebug Lite debugger in-page. Due to the amount of screen space (especially on an iPhone) it’s going to be a fiddly trying to do extensive debugging using your finger. Having access to the JavaScript console is really valuable and it also shows the status of AJAX calls being made and any resulting errors.
Firebug Console (iPhone)
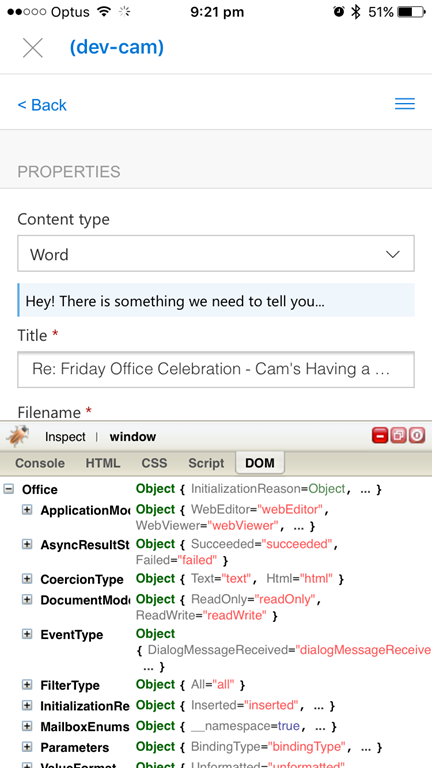
Firebug DOM explorer (iPhone)
Firebug HTML Inspector (Desktop Outlook)


This doesn’t work on iOS, works fine on android though, also is there a way to access the console in a desktop browser? Debugging on phone using hands is too tough
LikeLike
I’ve updated the code snippet as Firebug is no longer being taken format and the JavaScript files that this snippet loaded in had been removed. The code now sources the JavaScript file from cloudflare and is working again 🙂
LikeLike